We're Halfway to a Lost Decade
Our current slump began a lot earlier than you think. Which means that we’re half way to a lost decade.
Many people date the financial crisis as beginning when Lehman collapsed in September 2008. But the economy was already in recession. The NBER reckons the recession began in December 2007. But look closely, and you’ll see that it may have begun a year earlier.
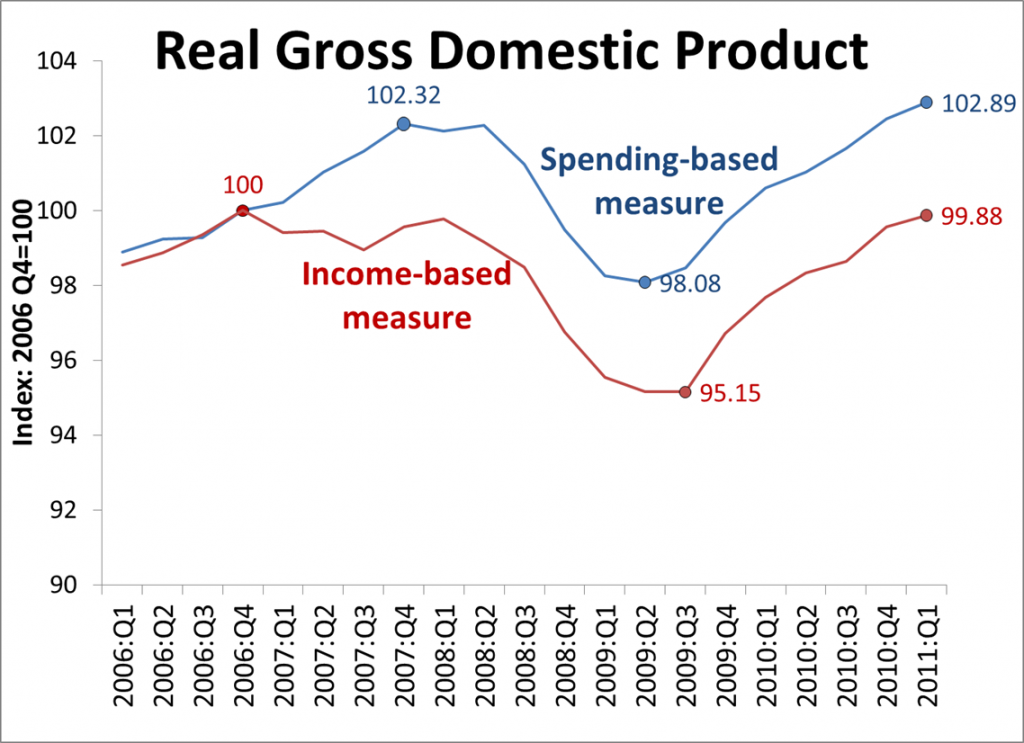
That’s the case I made in my latest my latest Marketplace commentary, which you can listen to here. The point is more easily made with a simple graph:

The blue line is the usual measure of GDP, which is obtained by adding up total spending. When you read the newspapers, this is the number they report. But the Fed’s Jeremy Nailewaik has convincingly shown that red line—which is the sum of all income—is the more reliable measure. In theory the two lines should be identical—one person’s spending is another’s income—but in practice, the measurements differ. I’ve also plotted the peak, trough, and latest reading of each measure.
Focus on the red line, and you’ll see that the recession began in the final quarter of 2006, not the end of 2007. The red line also fell by more, and over a longer period. And today, GDP remains below its levels nearly five years ago. The economy had already run out of steam halfway through Bush’s second term. That’s why I say we are halfway to a lost decade.
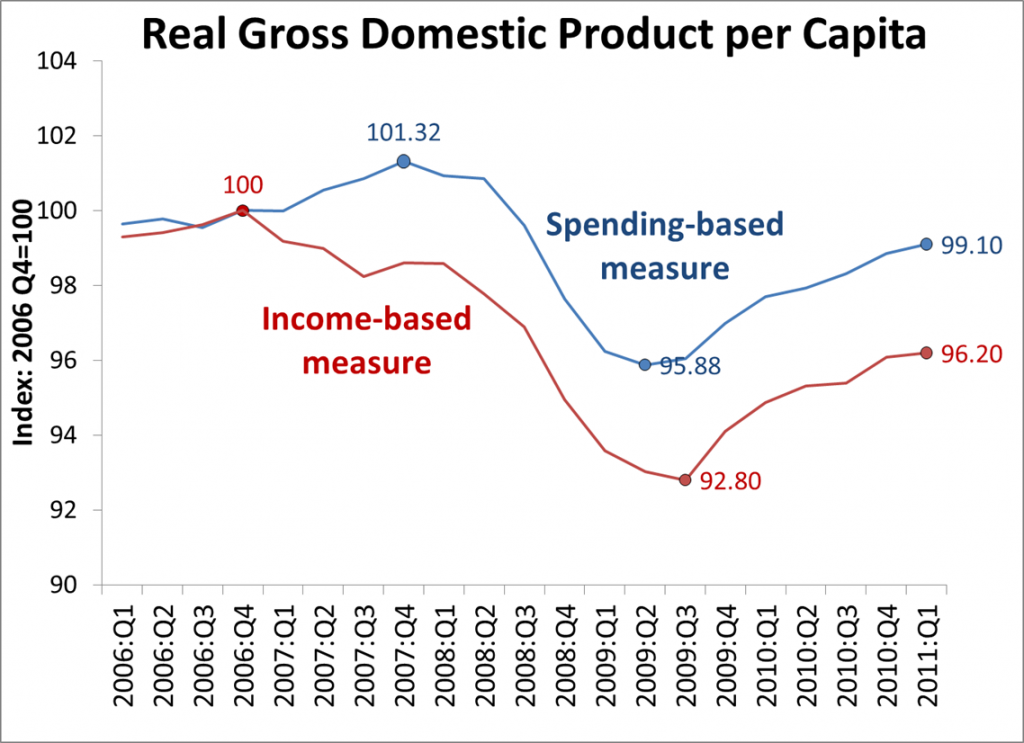
Even this isn’t a fair comparison, as the population has continued to grow. So let’s transform these into per capita numbers:

The red line now shows five things much more clearly:
1. The slump began in late 2006. And indeed, we were hardly enjoying good times through early 2006.
2. It’s a big slump, and GDP per capita fell by over 7 percent.
3. We remain a long way below the previous peak.
4. It’s going to take a long while to return to where we were back in 2006. Most forecasters are expecting GDP to grow by around 3 percent, implying per-capita growth closer to two percent. At those rates, average incomes in 2013 will (finally!) be back around the levels of 2006.
Finally, it’s worth emphasizing another key statistical finding from Nalewaik’s research: Over the next few years the Bureau of Economic Analysis will continue to revise their estimates of what has happened, and if history is any guide, their revised estimates of the blue line will look a lot more like the red line.

Comments