Graph Fight! More on Taylor’s Scatterplot
More on John Taylor‘s by-now infamous scatterplot. Earlier, I wrote that I thought he cherry-picked his data, so as to make the link between investment rates and unemployment look artificially strong. Taylor has responded. His observation is considered, and reasonable:
This shift up in unemployment in the 1970s and 1980s was due in part to the well-documented longer term increase in the natural rate of unemployment in the 1970s and 1980s, which many macroeconomists have researched and written about, but which Wolfers does not mention.
He then concludes:
When you recognize that such longer-term historical trends exist, you can see that there is a strong correlation between investment and unemployment that goes back before 1990.
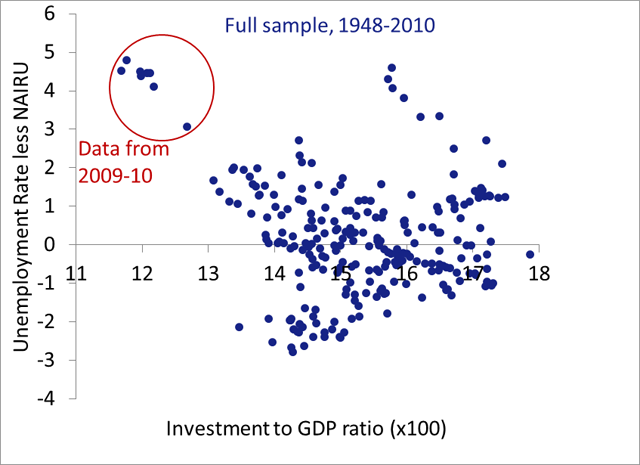
While Taylor’s observation is correct, I think it’s worth examining whether his conclusion follows. Here’s the simple exercise that this logic suggests: Let’s replace the unemployment rate in Taylor’s scatter plot with the unemployment rate, less the natural rate (using CBO’s estimate of the NAIRU).

There’s no “strong correlation” here. Yes, there’s still a negative correlation, but it remains a relatively weak -0.20, even after making the adjustment he suggests. I don’t want to get into the business of cherry-picking data, but should also note that this negative correlation is attributable entirely to the past two years. For the preceding 60 years, the correlation is in fact mildly positive!
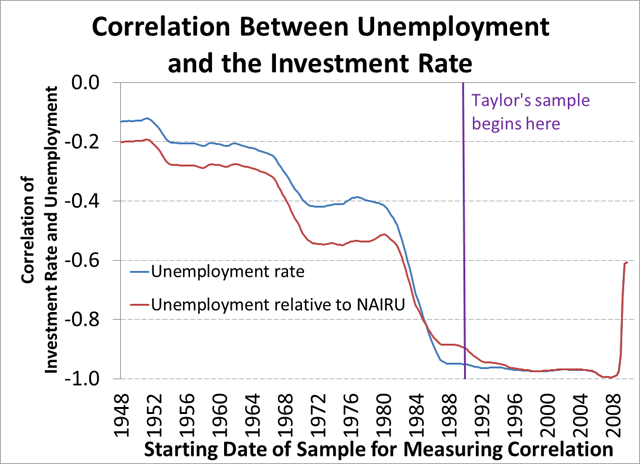
But my point isn’t to deny that a correlation may exist. It’s that Taylor chose a sample period that clearly overstates the reliability of this relationship. The next graph shows how strong the unemployment-investment rate correlation is, according to when you begin your sample. The blue line shows this for the actual unemployment (as in Taylor’s original post), while the red line shows this for unemployment relative to the natural rate.

Starting the sample in 1990 appears to dramatically overstate the extent of this correlation.
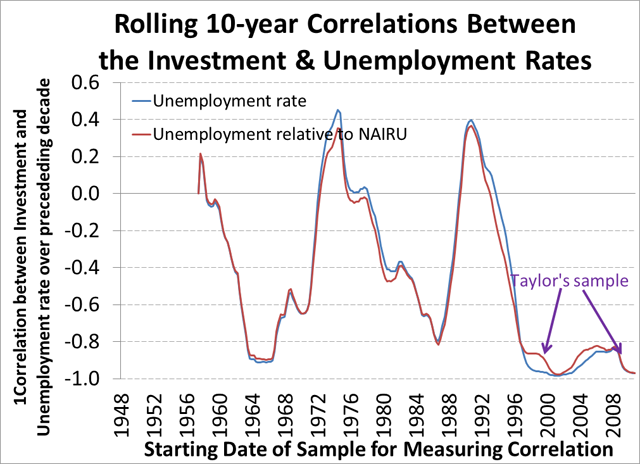
Recall Taylor’s response that “there is a strong correlation between investment and unemployment that goes back before 1990.” Let’s test this. I’ll tweak the graph above, but this time take rolling 10-year windows of data (so now the data point for, say 1989 Q4 is the correlation between unemployment and the investment rate over the sample from the beginning of 1980 to the end of 1989):

The correlation between unemployment and investment is strongly negative, except when it isn’t. And accounting for changes in the natural rate of unemployment — as the red line does — doesn’t much change this conclusion. Taylor’s sample essentially consists of the 10-year correlation measured in 2000, and again in 2010. Obviously, these are two well-chosen points.
My observation remains: An honest assessment of the data should acknowledge the tentative nature of the conclusions drawn from a selected sample. There may also be real changes in the economy that explain why the strength — and indeed, sign — of this correlation has varied, although at this point, I’m confident that Taylor is wrong to argue that this variability is due to changes in the natural rate of unemployment.
Ironically, this is an issue that the younger John Taylor understood very well. One of my favorite Taylor papers — addressing a different topic, to be sure! — is “The Deterrent Effect of Capital Punishment: Another View” which argues pretty compellingly that:
Behind the use of time-series estimation is the assumption that the structure and coefficients to be estimated remain stable over the sample period… If this assumption is in fact not correct, the estimated function would have little use either as an explanation of the causes of murder or of the policy implications of changing the value of an exogenous variable in the structure.
In that paper, he finds that correlations estimated over the 1936-69 period depended critically on data from 1963-69, and hence that the controversial results of Isaac Ehrlich were too fragile to warrant reliance.
For more on the scatter plot, see also: Krugman (and again, and again and again); Taylor twice; DeLong twice; and Drum.

Comments